7 Proven Methods to Evaluate Channel Partner Performance Metrics in 2026

Anyone who’s managed a channel partner program knows the frustration of pouring hours into dashboards, only to realize you’re still in the dark about what’s actually working. You might have a dozen reports, but when your CRO asks, “Where are our best partners stuck?” or “Are our incentives paying off?” the answer gets fuzzy. The truth is, most channel teams get buried in metrics but rarely turn them into real program improvement. If you want to stop wasting time on vanity numbers and start seeing results—growth, loyalty, and less churn—you need methods that tie data to action, not just reporting for compliance.
Setting Data-Driven Performance Benchmarks
Benchmarks are the anchor points that tell you what’s “good” in channel performance—and they’re rarely static. For 2026, industry leaders recommend aiming for partner-sourced annual recurring revenue (ARR) to hit between 20% and 40% of your total new ARR, especially as your program matures. Hitting this range means your partners are more than window dressing—they’re a true revenue engine.
Deal registration is another early indicator of health. The sweet spot cited by Computer Market Research and Channels as a Strategy is at least 1–2 deals registered per active partner per quarter. Drop below this and you’re likely facing engagement issues, or worse, pipeline stagnation.
Time-to-first-deal is one of those KPIs that tells a story in a single number. If new partners are closing their first deal within 90 days, your onboarding is tight. If it’s dragging past 180 days, that’s a clear signal to revisit your training, product complexity, or support. Churn matters too: keep annual partner churn under 15%. Anything higher could mean your program is leaking value or has misaligned incentives.
Don’t ignore softer metrics. For enablement, you want at least 80% of your top-tier (tier 1) partners completing core training, and a minimum of 50% across your active base. Finally, partner satisfaction—measured by PSat scores—should be at or above 7.5 out of 10. If you’re dipping below that, expect to spend more time fighting fires than growing accounts.
Building a Modern Partner Performance Scorecard
The right scorecard distills dozens of data points into a page any stakeholder can scan in seconds. It’s not a spreadsheet dump. Instead, it’s a curated mix that covers partner tier (so you see at a glance who should be delivering more), deal registration counts from the last 90 days, and partner-sourced pipeline created in the previous quarter.
Closed ARR over the last 12 months gives you a rolling look at real impact, not just potential. Training certification status is essential for identifying whether enablement efforts are landing. If a partner hasn’t logged into the portal recently or their certifications are out of date, you know where to focus your next call.
Don’t skip the partner satisfaction score. If you’re tracking PSat in the same dashboard as pipeline and ARR, you spot the warning signs early—like a high-revenue partner suddenly reporting low satisfaction. This single-page view transforms QBRs and executive reviews from “here’s what happened” to “here’s where we act first.”
Scorecards should be refreshed for every QBR and referenced in partner agreements, especially for new partners. When you make these metrics visible and tie them to incentives—or even tier status—you move the conversation from vague commitments to clear, data-backed accountability.
Establishing a Proactive Review Cadence
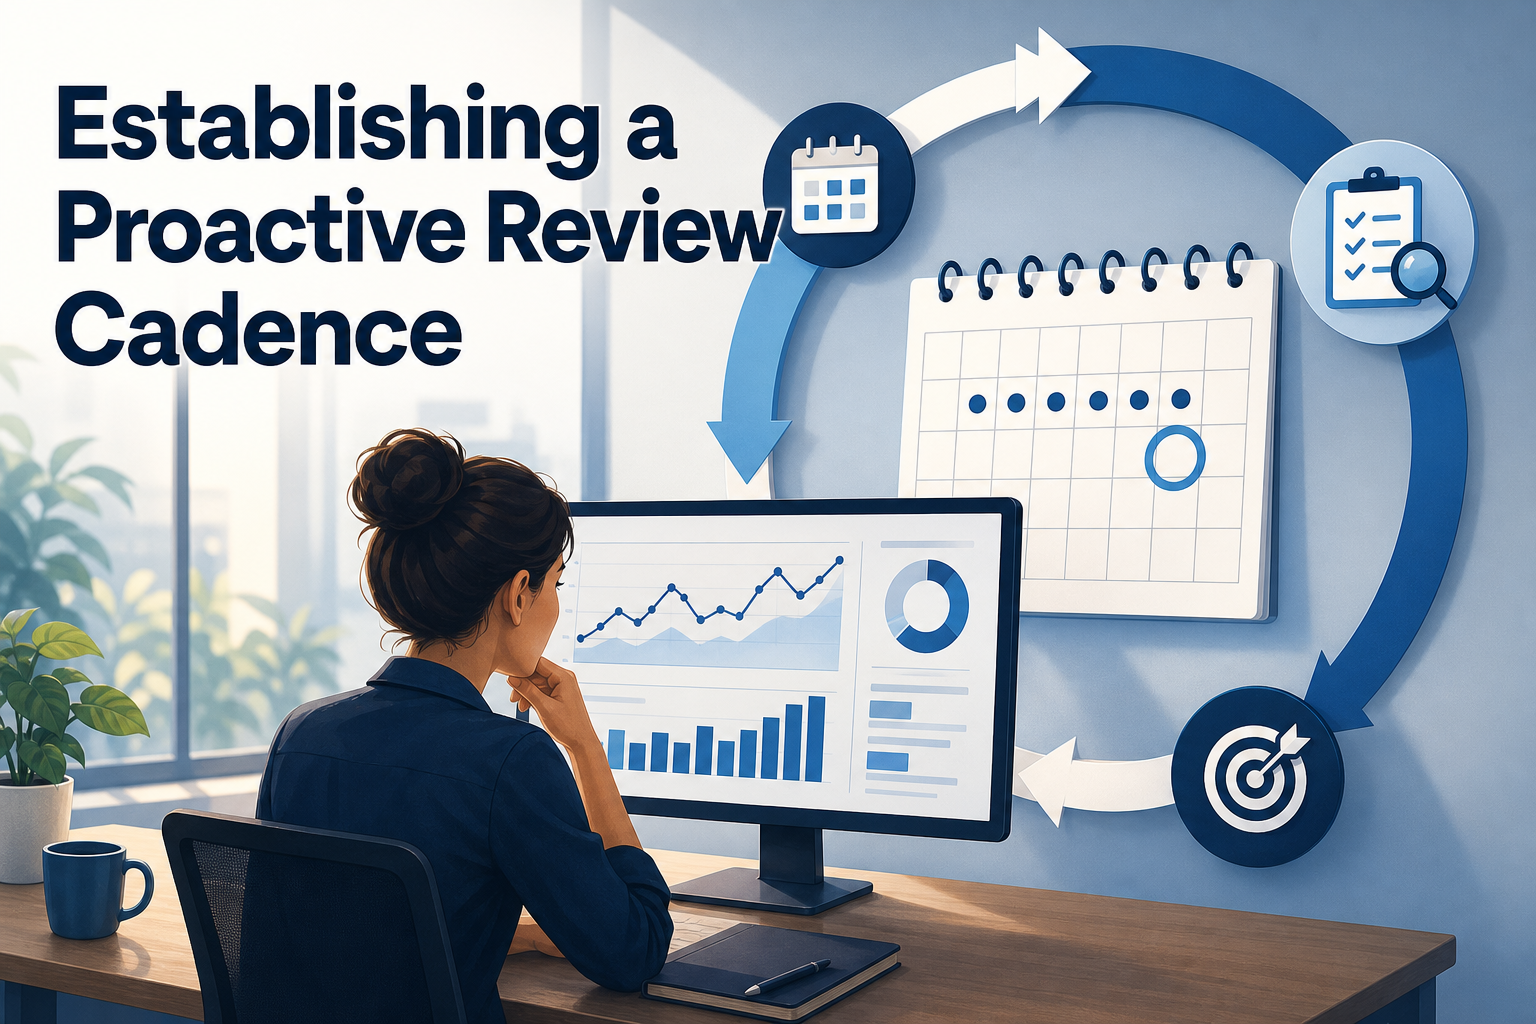
Metrics that sit untouched until Q4 reviews won’t drive improvement. The most effective channel teams have a rhythm: quick weekly dashboard checks for sales and pipeline metrics, and deeper quarterly audits of partner tiering and incentive ROI.
Weekly reviews help you spot short-term shifts—like a spike in deal registrations after a campaign or a sudden drop in portal logins. These fast feedback loops mean you can adjust enablement or marketing in real time, not months later when the damage is done.
Quarterly, go deeper. Are your tiering criteria still relevant? Has incentive spend actually moved the needle, or are rewards going to partners who’d have closed anyway? These sessions are not just for reporting. They’re where you set new targets, sunset what’s not working, and get buy-in for pilot programs.
For early-stage programs, even monthly pipeline check-ins can be critical. At this stage, focus review meetings on momentum metrics like registered-to-closed conversion, time-to-first-deal, and pipeline growth by partner. Document these in QBR templates so nothing slips through the cracks.
Measuring Marketing Engagement and MDF ROI
Too many partner programs treat marketing engagement as “nice to have” instead of a core performance driver. But the data says otherwise. Tracking portal logins gives you a sense of partner touchpoints—if someone hasn’t accessed resources in weeks, you can’t expect campaign execution.
Downloads of campaign assets, registrations for webinars, and the number of events hosted provide clear signals of a partner’s marketing muscle. If a partner regularly pulls new assets and attends enablement events, you can bet they’re more likely to register and close deals.
Don’t just track activity—measure impact. The Marketing Development Fund (MDF) ROI formula is simple: ((MDF Revenue Generated – MDF Expenditures) / MDF Expenditures) × 100. Use this calculation to compare which partners are turning investments into pipeline, and which need a marketing plan reboot.
Comparing campaign engagement and MDF ROI across your partner base helps you spot leaders and laggards. It also arms you with the data to reallocate funds next quarter. The difference between a partner who logs in weekly and submits high-ROI MDF reports, versus one who’s gone dark, couldn’t be clearer.
Designing Actionable Dashboards for Channel Teams
A real-time dashboard is more than a digital scoreboard—it’s the nerve center of your channel program. The best dashboards pull in live data, so you’re not working off last month’s stale numbers. Use integrations with your CRM, PRM, and even third-party enrichment tools to round out partner profiles.
Don’t overwhelm users with every available metric. Instead, align dashboard views to corporate goals—sales, enablement, retention—and group related KPIs together. For example, show time-to-first-deal next to onboarding resources usage, or MDF ROI next to campaign asset downloads. This makes patterns and outliers jump out.
Train your channel and sales teams to interpret what they see. It’s not enough to display numbers; people need context. Add tooltips, suggested actions, or simple “what to do next” prompts based on trends. For instance, if deal velocity slows, the dashboard might highlight which partners haven’t completed recent training.
Regularly review your dashboard setup. As company priorities shift or new products launch, your metrics should evolve. The dashboard is a living tool, not a static report. When everyone trusts and uses it, you’ll see better alignment—and faster response—across your channel team.
Evaluating Metrics Across the Partner Lifecycle

Not all metrics matter at every stage. That’s why the smartest programs group KPIs by the partner journey: onboarding, enablement, growth, and retention. For onboarding, focus on time-to-first-deal and portal adoption. If partners aren’t closing deals within a reasonable time frame or logging in regularly, your onboarding approach may need to be revisited. [S2][S7][S3]
Enablement is measured by certification completion and technical proficiency. Map these against pipeline growth to ensure training translates into sales motion. During the growth phase, year-over-year revenue increases and diversification into new products are your best signals of a maturing partnership.
Retention is about sticking power. Partner churn under 15% means your value prop and support are resonating long term. Keep an eye on engagement metrics—like training refresh rates and portal logins—especially for partners with declining revenue. Satisfaction surveys (PSat) should be a staple, not an afterthought.
For early-stage programs, keep it simple. Prioritize momentum KPIs: deal registration volume, time-to-first-deal, and partner-sourced pipeline. Make these explicit in partner agreements and review them in QBRs so both sides stay aligned on what success looks like.
Turning Metrics into Action
Collecting metrics is only half the battle. The real win is turning numbers into next steps that actually move your program forward. If your partner churn rises above 15%, see this as a signal to dig deeper into the reasons behind attrition and consider reviewing your retention strategies. [S2][S3]
When a partner’s training completion drops, reach out with targeted enablement or incentives. If MDF ROI is lagging, work closely with that partner to co-build a campaign, or consider shifting funds to your top performers. Use your scorecard and dashboards not just for internal reviews, but as a shared language with partners. Show them where they shine and where they can grow.
Adopt a culture of quick wins and regular iteration. Set quarterly improvement targets based on your benchmarks, and celebrate when partners hit them. When issues emerge, act fast—don’t wait for year-end retrospectives.
In the end, the strongest channel programs are the ones that treat performance metrics as a foundation for action, not just a reporting requirement. When you tie benchmarks, scorecards, and real-time dashboards to concrete routines, you build a program that adapts, improves, and stands out in a crowded market. Take a hard look at your current process, start with one method from this guide, and watch your partner results shift from unpredictable to consistently strong.

I’m Omar Khalil, and I’ve spent the past decade working within the MEA technology channel ecosystem, from distribution in Dubai to partner enablement across Africa. I write about practical strategies for vendors, distributors, and resellers navigating the unique challenges of selling technology solutions in the Middle East and Africa. My focus is on actionable intelligence drawn from real market experiences, not generic theory. When I’m not writing, I’m usually at a channel event somewhere between Riyadh and Read the full About the author page.